Welcome to netgrafio’s documentation!
Contents:
![digraph foo {
TCPServer [shape = box, style = filled, color = yellow];
WebSocketServer [shape = box, style = filled, color = yellow];
FlaskApp [shape = box, style = filled, color = yellow];
"netgrafio" -> "TCP Socket";
"netgrafio" -> "Web Socket";
"netgrafio" -> "Web Application";
edge [color = red];
"TCP Socket" -> TCPServer;
"Web Socket" -> WebSocketServer;
"Web Application" -> FlaskApp;
edge [color = green];
TCPServer -> "lib/TCPServer.py";
WebSocketServer -> "lib/WebSocketServer.py";
FlaskApp -> "lib/WebServer.py";
FlaskApp -> "web/FlaskApp.py";
FlaskApp -> "web/core/*";
FlaskApp -> "web/mod_*/*"
}](_images/graphviz-93e300fb6901fe30befe0b2f548acade4ca18b09.png)
Quickstart
Make sure you have installed all the requirements on your system (specified in README.md). Afterwards you can clone this project:
$ git clone https://github.com/nullsecuritynet/netgrafio
$ cd netgrafio
Now you’ll need to setup a isolated python environment using virtualenv:
$ virtualenv env
Using base prefix '/usr'
New python executable in env/bin/python3
Also creating executable in env/bin/python
Installing setuptools, pip...done.
Make sure to activate the virtual environment:
$ source env/bin/activate
Having set the virtualenv environment let’s install some missing packages:
$ pip install -r env/requirements.pip
Now you’re ready to start netgrafion and have some fun.
These are the basic parameters:
$ python netgrafio.py -h
usage: netgrafio.py [-h] [--tcp-port TCP_PORT] [--ws-port WS_PORT]
                    [--web-port WEB_PORT] [--host HOST]

netgrafio - visualize your network

optional arguments:
  -h, --help           show this help message and exit
  --tcp-port TCP_PORT  Specify TCP port to listen for JSON packets (default:
                       8081)
  --ws-port WS_PORT    Specify WebSocket port to send JSON data to (default:
                       8080)
  --web-port WEB_PORT  Specify web port to server web application (default:
                       5000)
  --host HOST          Specify host to bind socket on (default: 127.0.0.1)
If you start netgrafio without any arguments, then you’ll have a
- TCP-Socket listening on port 8081
- WebSocket listening on port 8080
- Web-Application available at http://localhost:5000
After starting netgrafio:
$ python netgrafio.py
2014-04-24 16:18:12,984 - INFO - [WebSocketServer] - Starting WebSocket server on port 8080
2014-04-24 16:18:12,984 - INFO - [WebSocketServer] - Start collector server
2014-04-24 16:18:12,985 - INFO - [WebSocketServer] - Waiting for incoming data ...
2014-04-24 16:18:12,989 - INFO - [WebServer] - Listening on 5000
2014-04-24 16:18:12,989 - INFO - [TCPServer] - Listening on 8081
Now open your browser and navigate to http://localhost:5000
D3 Graph
This section describes the basic API of d3.graph.min.js. It describes how to build a graph using D3.
- class D3Graph(container)
Create a new D3 graph.
Arguments: - container (string) – Specify the element in the DOM where to show the graph
Returns: Instance of class D3Graph (SVG element)
Example:
myGraph = new D3Graph("#myElement");
- D3Graph.init()
Initialize the graph.
Example:
myGraph.init()
- D3Graph.start()
Start the graph.
Example:
myGraph.start()
- class D3GraphController(d3graph)
Control the D3 graph.
Arguments: - d3graph (D3Graph) – Object of type D3Graph.
Returns: Instance of class D3GraphController
Example:
myGraph = new D3Graph("#myElement");
graphController = new D3GraphController(myGraph);
- D3GraphController.addNode(nodeObject)
Add new node to the graph.
Arguments: - nodeObject (object) – Node object to be added to the graph
Example:
nodeObject = {
    "id": "some_unique_id"
   ,"class": "blue"
   ,"name": "This is my fancy name"
};

graphController.addNode(nodeObject);
- D3GraphController.findNode(id)
Find node by ID.
Arguments: - id (number) – ID of node to look up.
Returns: If found the node object is returned.
- D3GraphController.addLink(linkObject)
Add new link between 2 nodes.
Arguments: - linkObject (object) – Link object
Example:
// Add nodes
nodeObjectA = {
    "id": "A"
   ,"class": "A"
   ,"name": "B"
};

nodeObjectB = {
    "id": "B"
   ,"class": "B"
   ,"name": "B"
};


// Add link
var linkObject = {
    "source": nodeObjectA.id,
    "target": nodeObjectB.id,
    "linkclass": "dotted"
}

graphController.addNode(nodeObjectA);
graphController.addNode(nodeObjectB);
graphController.addLink(linkObject);
- D3GraphController.findLink(linkObject)
Find link by link object.
Arguments: - linkObject (object) – Should contain source and target
Returns: If found the link object is returned.
Example:
nodeObjectA = {"id": "A"}
nodeObjectB = {"id": "B"}
...
var linkObject = {"source": nodeObjectA, "target": nodeObjectB}
searched_link = findLink(linkObject)
...
- D3GraphController.getNodes()
Get array of nodes.
Returns: Array containing all node objects
- D3GraphController.getLinks()
Get array of links.
Returns: Array containing all link objects
- D3GraphController.update()
Update graph. Wrapper for D3Graph.update().
- D3GraphController.start()
Start graph. Wrapper for D3Graph.start().
TCPServer
WebSocketServer
WebServer
Flask application
Screenshots
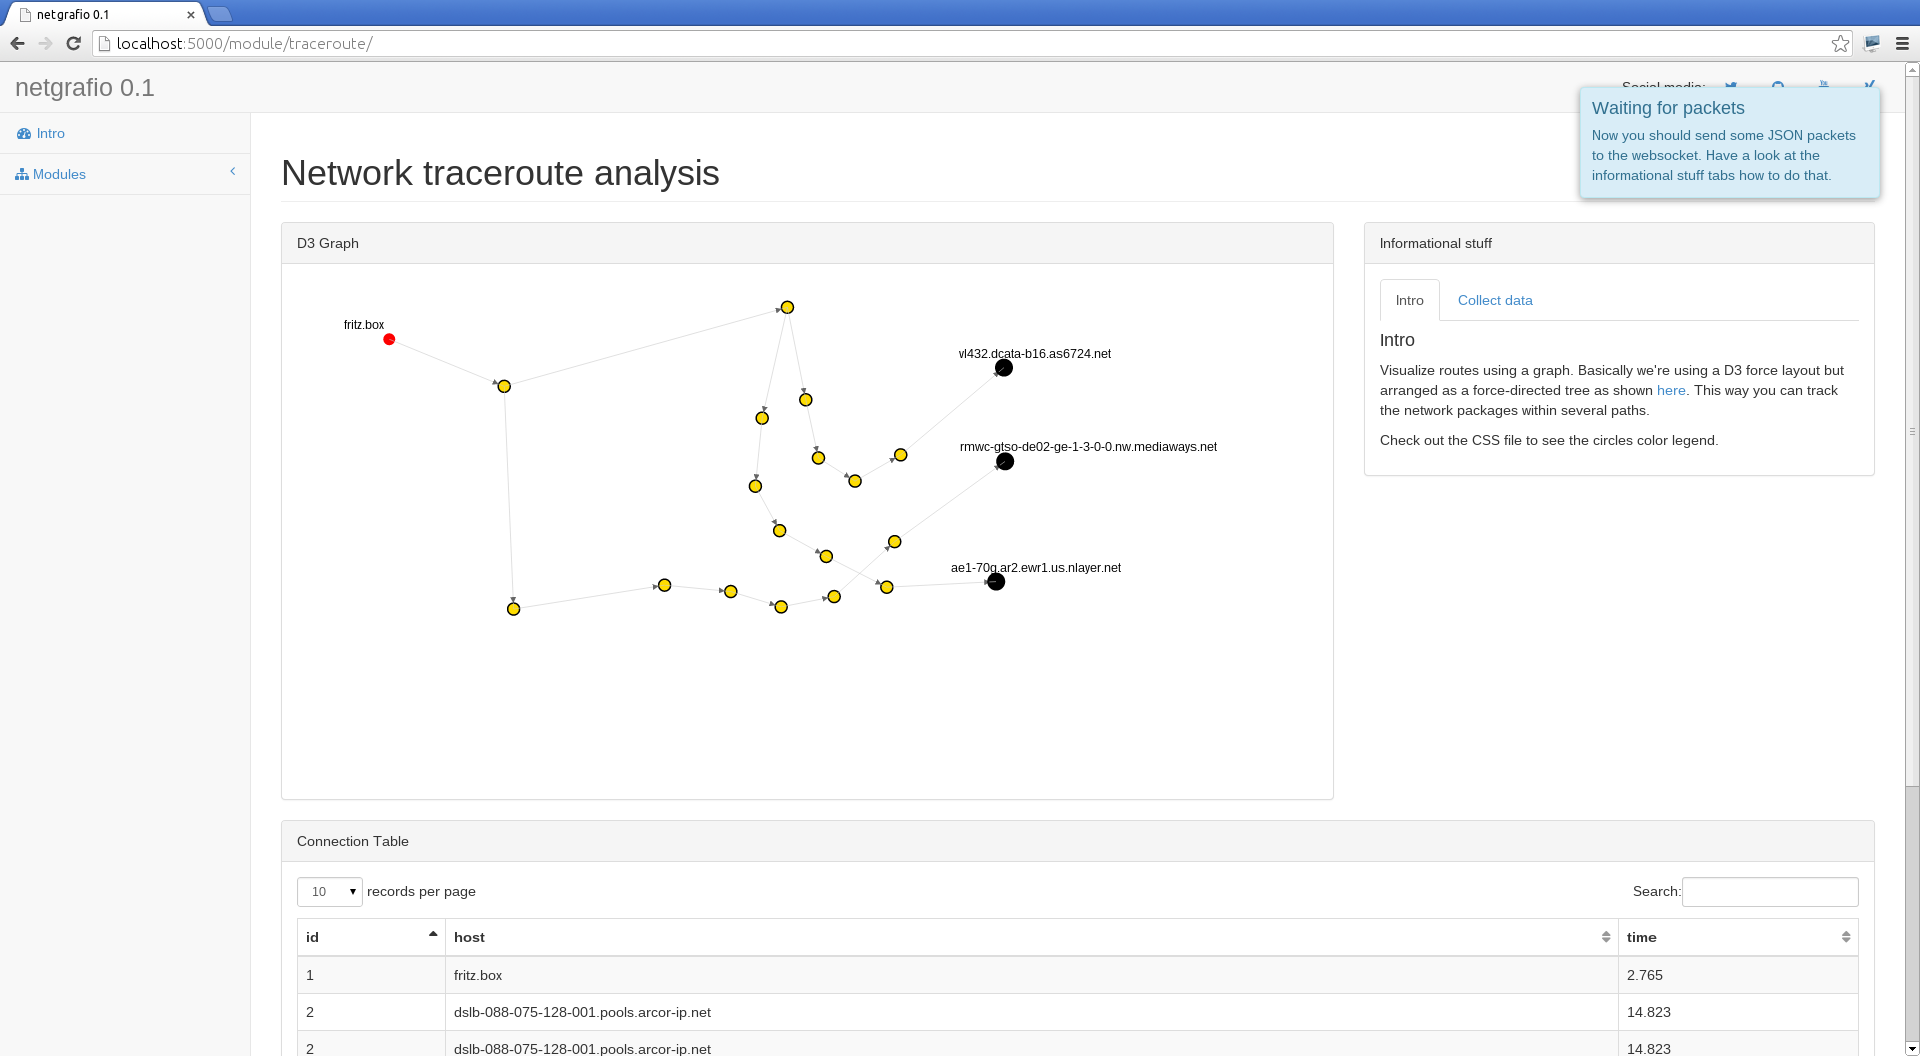
Do a traceroute using netgrafio
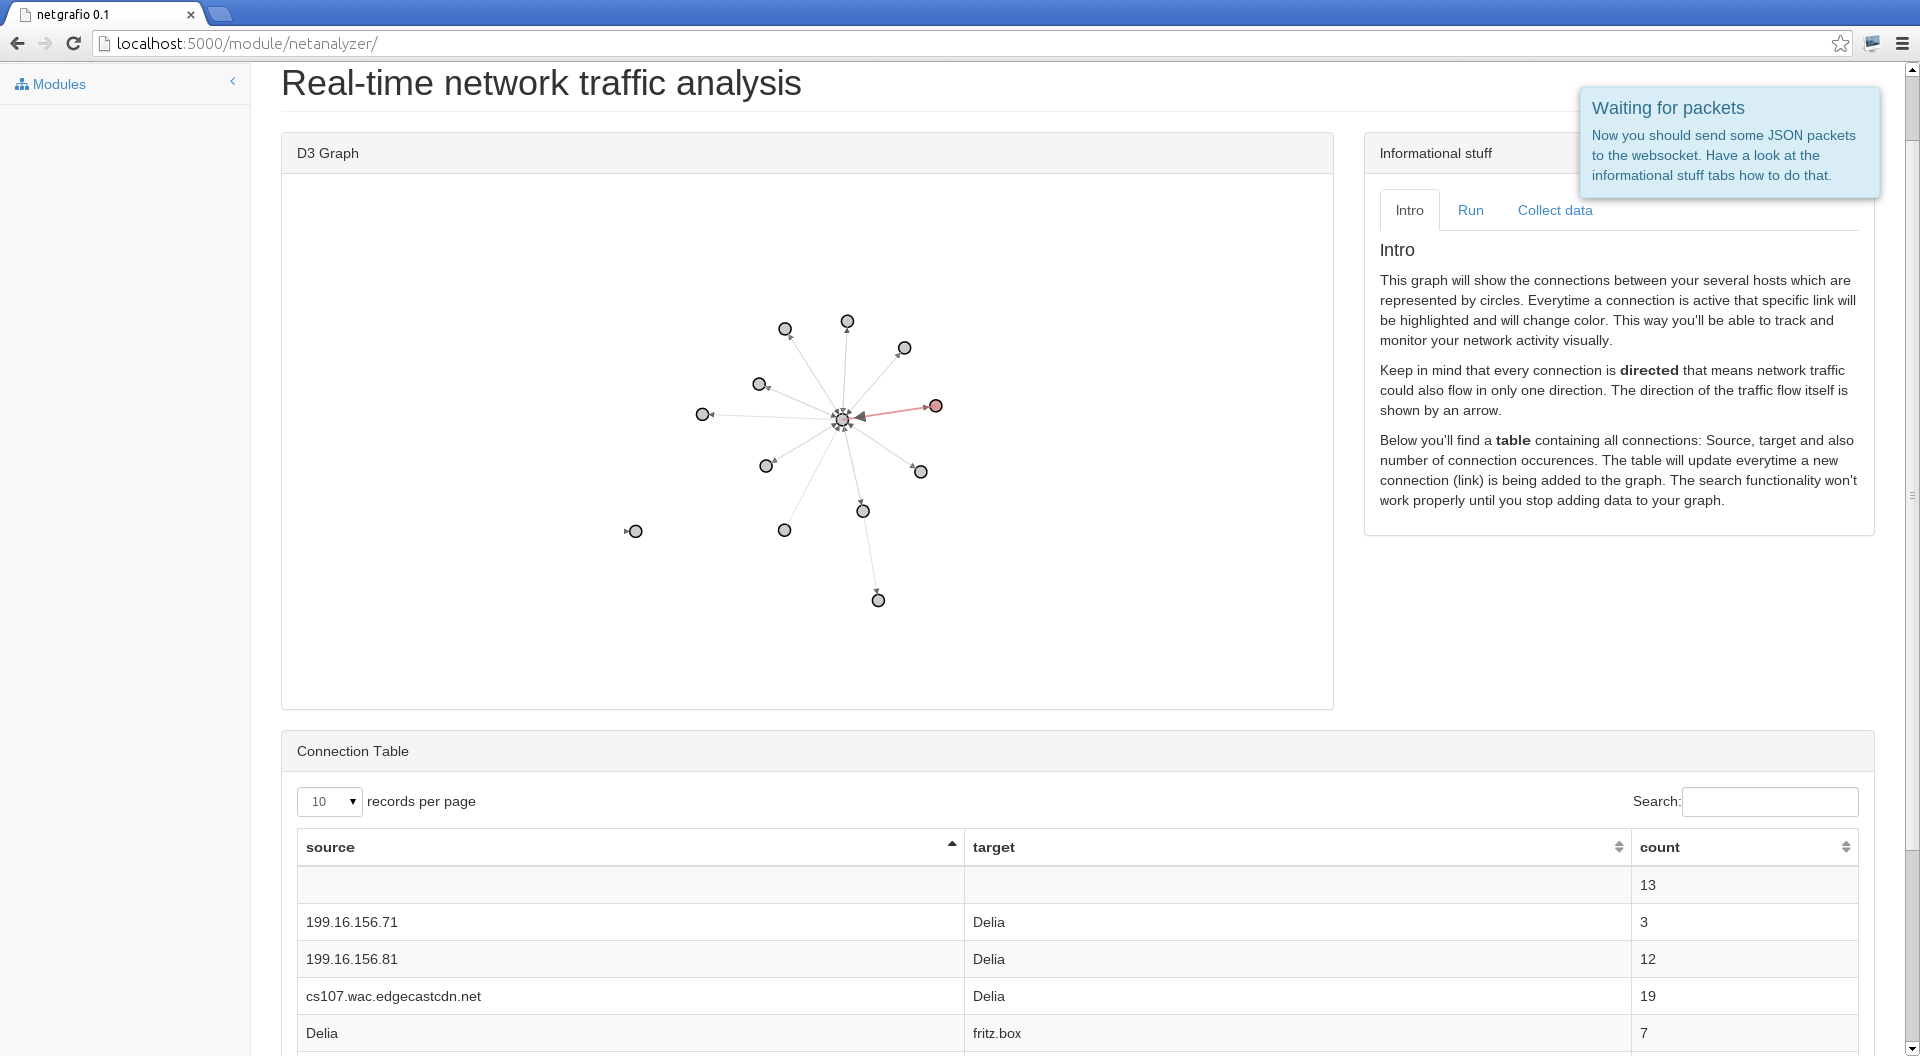
Analyze your network traffic (LIVE!)
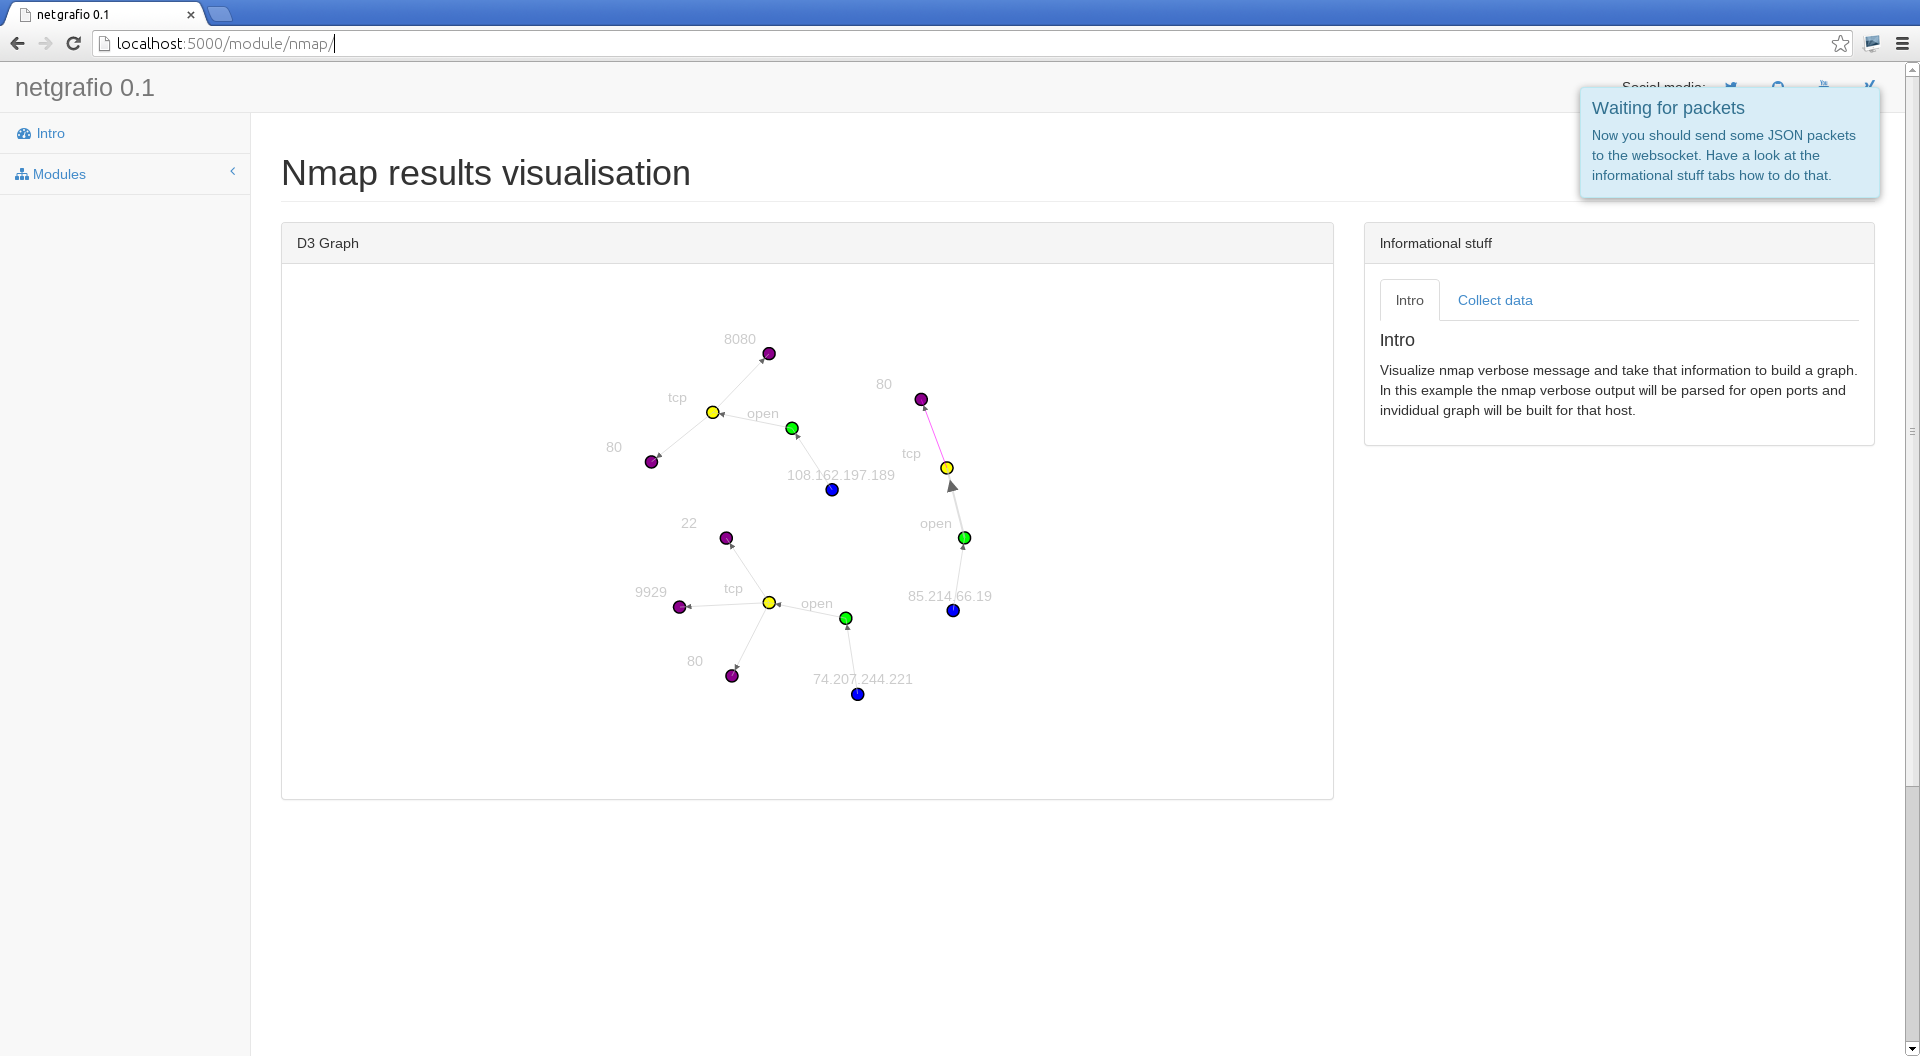
Visualize your NMap scanning results